
The Secrets of Your Electricity Meter – What the Display Doesn’t Show
When an electricity bill arrives that is higher than expected, it's completely understandable that a person wants to know what happened. At such times there are many questions, a lot of uncertainty, and often no data in hand from which the events can be calmly and factually reviewed.
But this is precisely what would be most important: not guessing, not arguing, but seeing.
This is what the ADA P1 Meter provides a solution for, helping the user monitor the operation of their electricity meter in real time, so they don’t only encounter consumption data at the end of the month when the bill arrives.
Data comes directly from the electricity meter
One of the most important advantages of the ADA P1 Meter is that it does not receive information from some cloud service, delayed or aggregated, but directly from the electricity meter, in real time.
In practice, this means that if you turn on a larger appliance — say a coffee maker, kettle, oven, or air conditioner — its effect immediately appears in the data. You can see that consumption increases, which phase is under load, and how the instantaneous energy flow changes.
This is important because energy use then is not an abstract figure at the end of the month but something you can follow with your own eyes.
It doesn’t tell you what to think, it shows what’s happening
The goal of the ADA P1 Meter is not to side with anyone nor to engage in guesses. It simply makes visible what the meter communicates.
Since the device does not measure separately on its own, but processes and logs data supplied by the electricity meter, the user sees the same data realm in more detail that the system itself uses.
This can be especially useful for those who want to better understand:
-
when their consumption increases,
-
when and how much is fed back,
-
which phase is under load,
-
if there is unusual operation,
-
and what patterns repeat day to day.
The electricity meter display is often insufficient
Most electricity meter displays only show instantaneous or cumulative values, which is useful but often insufficient.
If someone truly wants to understand why their consumption changes or why a total was higher in a period, more continuous and retrievable data presentation is needed.
The ADA P1 Meter helps with this: it doesn’t show just a number but relationships. It shows when a change occurred, at what rate, and alongside which other parameters.
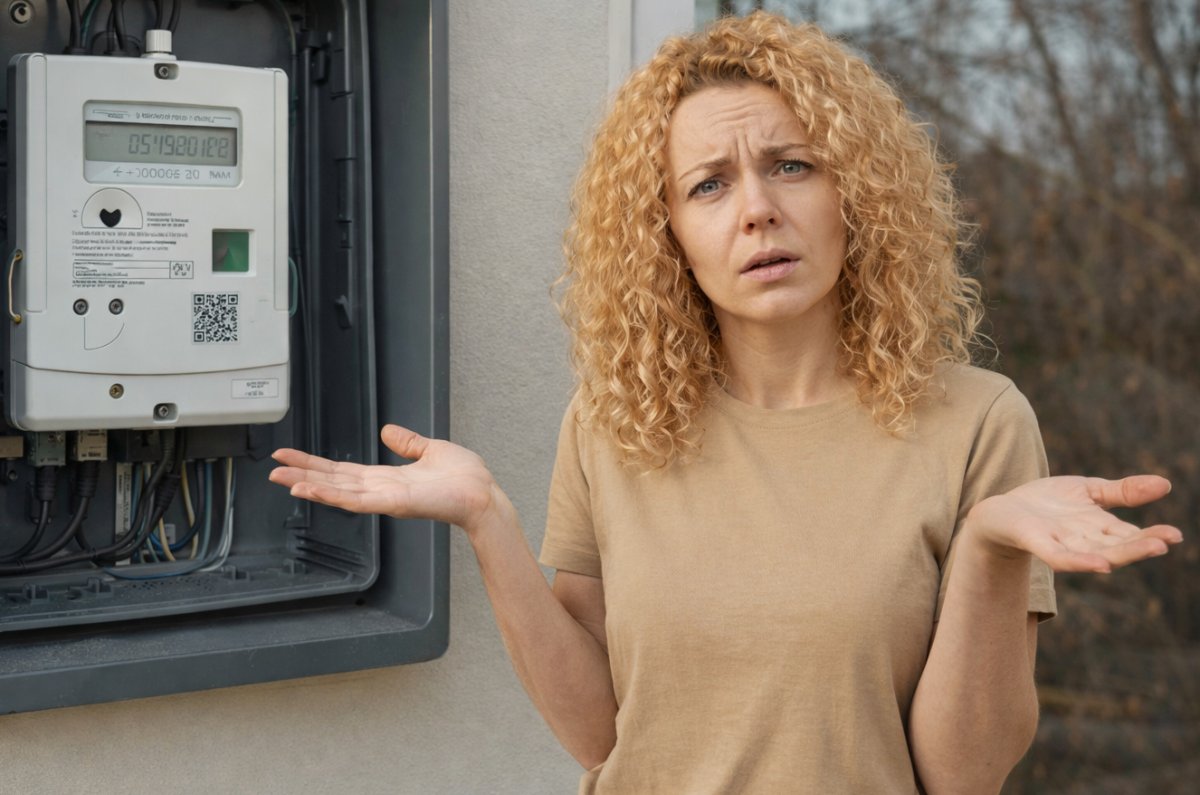
Higher bills don’t have to be analyzed retroactively
With the ADA P1 Meter you can also set prices, so not only is the current consumption or feed-in visible, but also what cost this is likely to represent.
Thus, the system helps so it’s not only discovered afterward that something unusual happened but that it can be noticed during the process. This is a big difference. Because when someone sees only the bill, it’s already too late. But if they monitor the data as it happens, a hidden consumer, a malfunctioning device, or an unusual load pattern can be detected much sooner.
Hidden consumers and strange operations are noticed sooner
Often the problem is not caused by a single large device but several smaller consumers together, or a device that continuously uses a lot of energy without being obvious.
These are much easier to recognize from detailed data. Load can be tracked phase by phase, reactive power data can be displayed, and in certain cases operational anomalies can also be noticed which would not be detectable based solely on the bill or the electricity meter display.
Timestamped data, retrievable
One great advantage of the ADA system is that data is saved with its own timestamp, so it can be precisely reviewed later what happened at a given time.
This means that if someone wants to investigate a specific day or period later, they don’t have to reconstruct events from memory but have the data in front of them.
Historical logging helps ensure energy use is assessed not based on feelings or impressions but on concrete time-series data.
Custom charts, from your own perspectives
Not everyone is interested in the same thing. Some monitor total consumption, others feed-in, others phase-by-phase behavior, or patterns during a particular time of day.
With the ADA P1 Meter unique charts can also be created from selected data, within a chosen time interval. This way everyone can seek answers to their own questions, rather than working with a fixed predefined view.
Can be integrated into local systems, not only cloud use
Daily data backups already help a lot, but there are also solutions for those who want to preserve and analyze data more extensively long term.
For a user, up to nearly 2 million data points can be recorded monthly. This can be convenient for those who do not want to deal with separate data backups at home.
At the same time, the ADA P1 Meter is not a closed system: it has multiple output options, so it can be integrated, for example, with InfluxDB, Grafana, Home Assistant, Domoticz, and other external systems.
The essence is simple
If someone wants to better understand what happens with their home electricity usage, the best answer is not guessing but monitoring.
The ADA P1 Meter helps ensure that electricity meter data isn’t hidden or hard to interpret. It makes consumption, feed-in, and changes in energy flow visible in real time, working directly from the electricity meter.
So whenever something happens in the network, its trace immediately appears in the data.
And this is the essence: it does not try to decide for you what the cause is, but shows you what happened.